1. Introduction: Signs of a Market at Its Inflection Point
The US stock market has reached a critical inflection point after three consecutive weeks of decline. The S&P 500 has retreated approximately 5% from its all-time highs, signaling a potential breach of the structural support levels warned by Goldman Sachs. Currently, the market is looking past the “lagging indicator” of stable February CPI data and reacting instinctively to the “real-time threat” of surging oil prices.
This tension stems from the divergence between stable inflation prints and skyrocketing energy costs. Investors are paralyzed by the fear that rising oil prices will immediately bleed into next month’s inflation data. However, the seasoned investor captures opportunity precisely at this moment of silence. Today’s volatility is a process of energy compression; to predict whether this pressure will erupt upward or collapse downward, we must first dissect the reality of “energy security” and “geopolitical risk.”
2. The Hormuz Hostage Crisis: Is Iran’s Blockade Sustainable?
Oil prices have become a “black hole” overwhelming all market fundamentals. The threat of a blockade in the Strait of Hormuz—through which 8 million barrels of oil flow daily, according to the IEA—is enough to drive the market into a frenzy. Yet, a cold-blooded analysis suggests the likelihood of this becoming a “Second Oil Shock” leading to a long-term recession is remarkably low.
Iran’s blockade is, in reality, a “threat with a short expiration date” due to internal constraints. The nation faces not only crumbling infrastructure and weapon shortages but also existential crises regarding food and water security. Furthermore, Tehran lacks the economic stamina to sustain a blockade that severs its own lifeline of exports to China and India. The recent signs of friction from its ally, Hamas, further highlight Iran’s growing international isolation.
Unlike the 1970s, the modern economy’s dependence on oil has diminished significantly. The Strategic Petroleum Reserve (SPR) held by the US and IEA member nations can buffer a complete blockade for about 20 days. Combined with the optimization of the Iraq-Turkey pipeline and production hikes from Venezuela and US shale producers, Iran’s leverage is being neutralized. In short, the current risk is more “psychological noise” than a structural supply chain collapse.
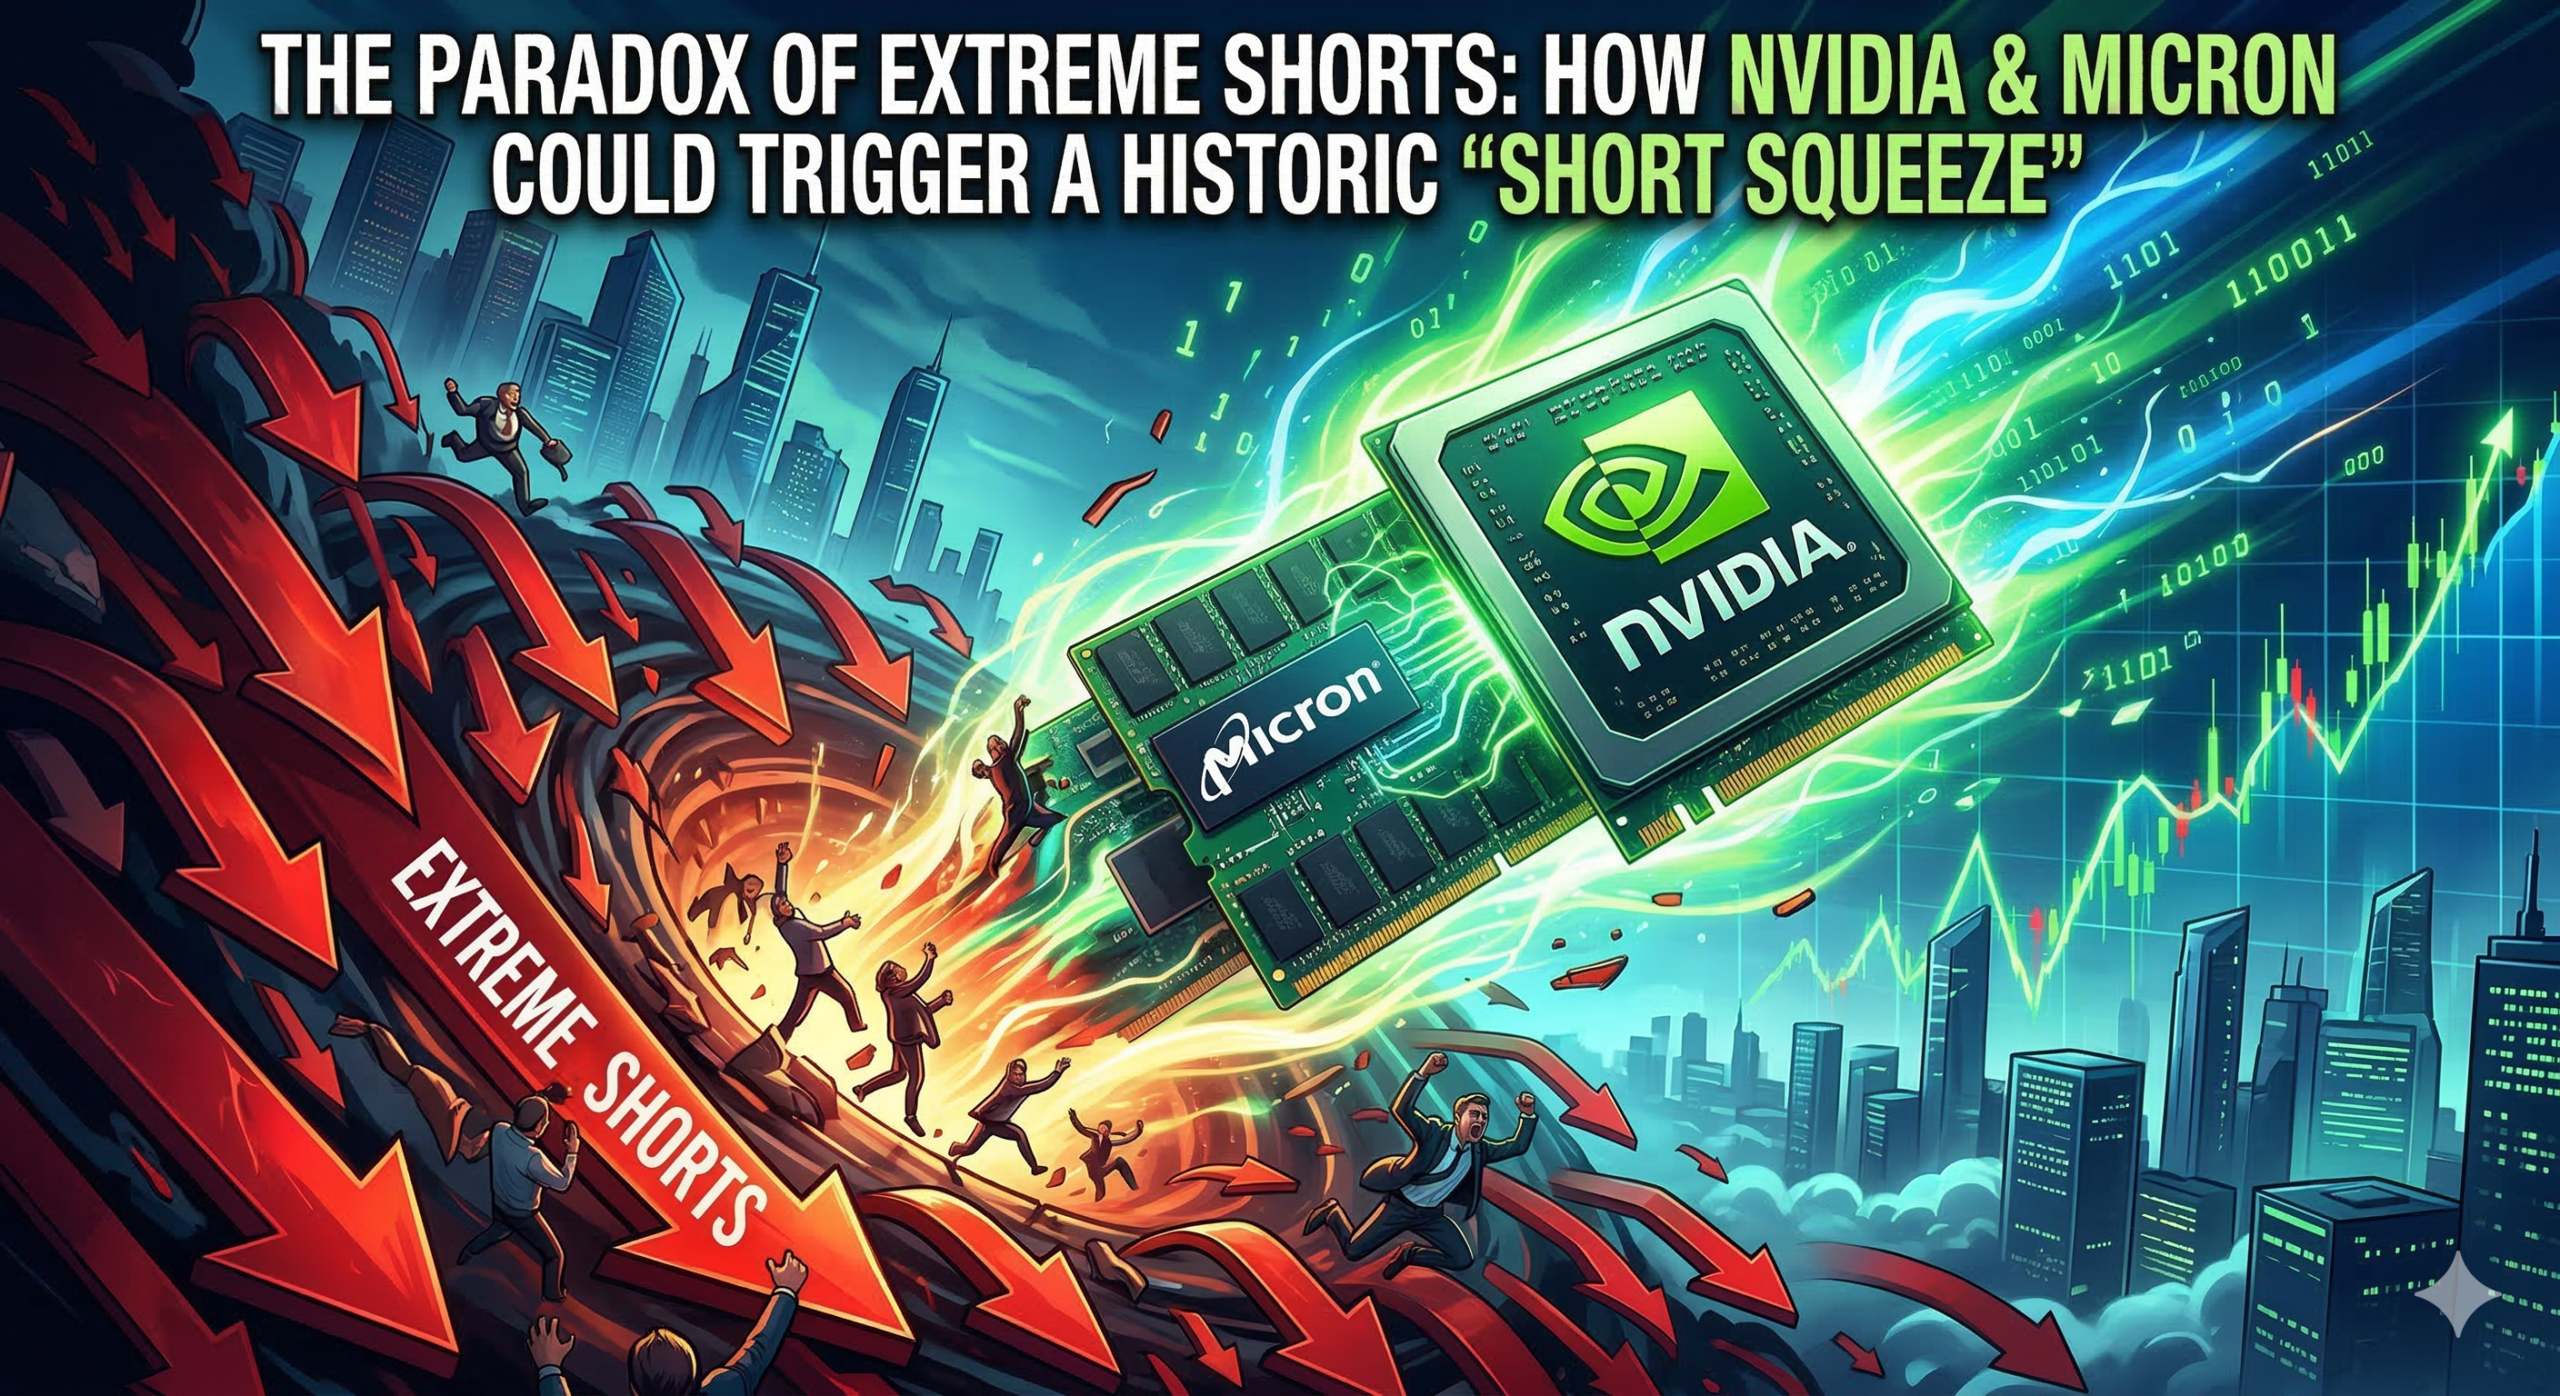
3. The Double-Edged Sword of Record Shorts: Squeeze or Crash?
Short bets on index futures and ETFs have surged to multi-year highs. This massive hedging position by institutional investors has made the market hyper-sensitive. While this serves as a fuse for “programmed selling” during a downturn, it also acts as “dry tinder” ready to ignite an explosive rally upon any reversal.
Historical data provides us with clear probabilities:
- Reaching the Capitulation Point: During geopolitical crises, the S&P 500 sees an average drawdown of 4.7% to 7%. The current -5% correction suggests we are already in the “bottoming zone.”
- Probability of Reversal: Historically, markets find a floor within 19 days of a geopolitical shock, with a 70% probability of being higher 12 months later. The average recovery period is a mere 42 days.
This Friday (3/20), “Quadruple Witching Day,” will be the crescendo where these massive short positions must be liquidated or rolled over. If we see even a faint signal of improvement in the Middle East or positive macro data, a wave of short covering could trigger a violent “Short Squeeze” that catapults the entire market.
4. Re-evaluating AI Infrastructure: The Truth in the PEG Ratio
Claiming “AI stocks are expensive” based solely on P/E ratios is amateur hour. When looking at the PEG (Price/Earnings-to-Growth) ratio, which accounts for earnings momentum, the current correction offers a rare valuation-driven entry point.
| Company | Est. PEG Ratio | Strategic Implication |
| Micron (MU) | 0.16 – 0.2 | Undervalued HBM momentum; Earnings (3/20) as a catalyst. |
| Broadcom (AVGO) | 0.6 | Robust growth backed by strong Free Cash Flow (FCF). |
| AMD | 0.6 | Valuation justified by accelerating AI demand. |
Micron’s PEG ratio of under 0.2 proves that its stock price is extremely depressed relative to the explosive demand for AI semiconductors. These companies, armed with powerful FCF, are generating tangible profits that will eventually drown out the temporary noise of oil risks.
5. The Fateful Week of March: Peak Volatility and Reversal Signals
This is “Super Week,” featuring the NVIDIA GTC, the FOMC meeting, Micron’s earnings, and Quadruple Witching. These events will act as the “escape valve” for market direction.

- NVIDIA GTC (3/18~): Jensen Huang’s next-gen roadmap will reaffirm the fundamentals of the AI sector.
- Micron Earnings (3/20 Post-market): HBM3E production milestones and guidance could be the trigger for a sector-wide short squeeze.
- FOMC Dot Plot (3/20): If the projection of three rate cuts remains intact, the market will shrug off stagflation fears and enter a “Bull Run.”
- Quadruple Witching (3/22): The convergence of record shorts and options expiry will result in a volatility peak with explosive trading volume.
The moment Jerome Powell’s commentary and the dot plot numbers end the market’s “hostage situation,” suppressed buying pressure will erupt.
6. Strategic Bottom Line: 3 Checklists for Crisis Response
As fear reaches its zenith, here is your tactical playbook:
- Beware the Algorithmic Trap: Expect “Programmed Selling” during peak volatility. Do not get swept up in technical liquidations; stick to your valuation-based entry zones.
- Conviction Through Data: Focus on Micron’s hard data on March 20th and the FOMC numbers rather than geopolitical noise. Data does not lie.
- Trust the Recovery Odds: In 2022, when oil crossed $100, holding QQQ from the depths of fear yielded an 87% return in just four months. Trust the 70% rebound probability and the 42-day average recovery cycle.
7. Conclusion
The US market stands at a crossroads, held captive by the drama of oil and war. However, considering Iran’s internal fragility, the flexibility of global energy chains, and the paradox of record-high short interest, we are likely on the eve of an “explosive rebound” rather than a collapse. Finding the basis for optimism when pessimism is rampant is the only way to thrive on Wall Street. Trust the data, trust the probabilities, and turn this fateful week into your greatest opportunity.
“Not a recommendation, just a shared strategic outlook. These are my personal reflections for collaborative study. Trade at your own discretion, share your unique views, and let’s grow together.”
Leave a Reply